随着技术的发展,开发的复杂度也越来越高,传统开发方式将一个系统做成了整块应用,经常出现的情况就是一个小小的改动或者一个小功能的增加可能会引起整体逻辑的修改,造成牵一发而动全身。
通过组件化开发,可以有效实现单独开发,单独维护,而且他们之间可以随意的进行组合。大大提升开发效率低,降低维护成本。
今天给大家介绍的一款组件: 前端Vue uni-appApp/小程序/H5通用tree树形结构图 ,附源码下载地址 : https://ext.dcloud.net.cn/plugin?id=13604
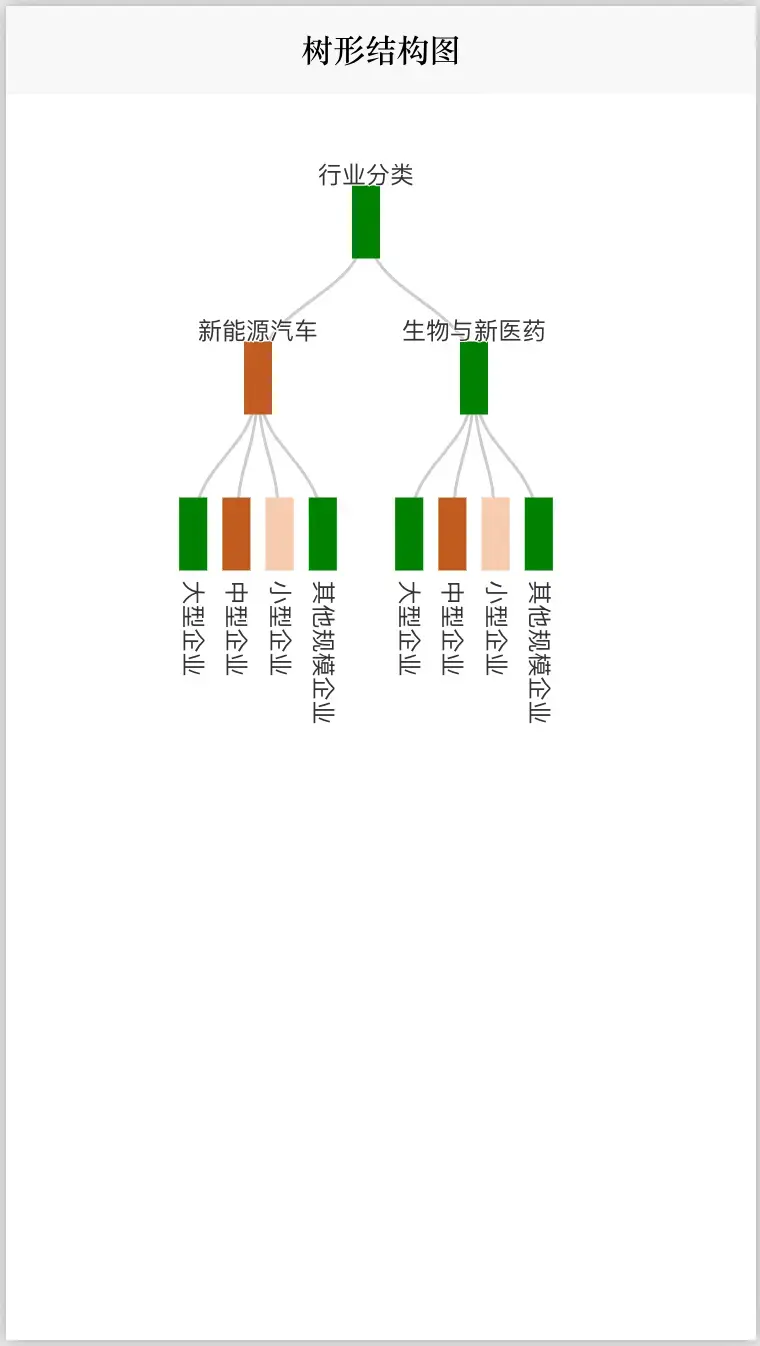
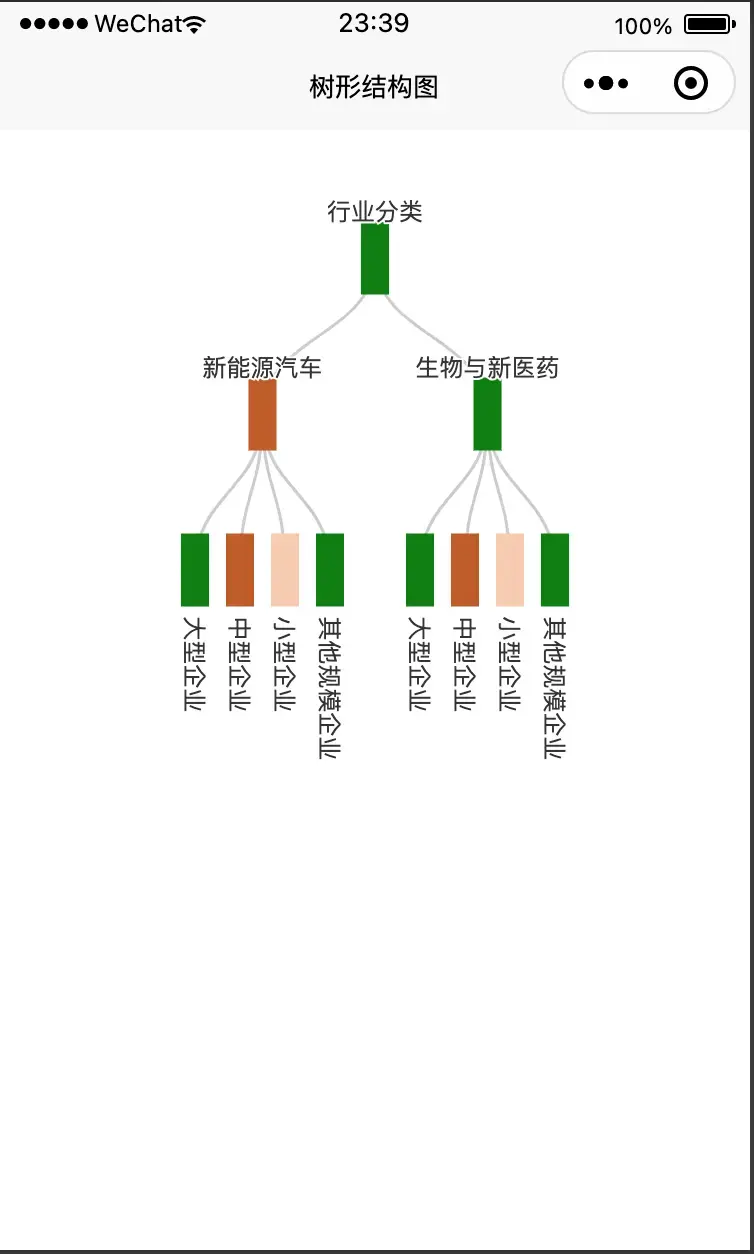
效果图如下:


cc-treeChart
使用方法
<!-- 引入lime-echart组件 -->

import LEchart from '@/uni_modules/lime-echart/components/l-echart/l-echart.vue';

import * as echartsLime from '@/uni_modules/lime-echart/static/echarts.min'

export default {

components: {

LEchart

},

}

<l-echart ref="chart" @finished="init"></l-echart>

<!-- 在method实现init方法 -->

async init() {

var fatherColor = 'green';

var midColor = 'rgb(193, 92, 31)';

var smallColor = 'rgb(247, 203, 174)';

// 新能源汽车

let swyyQ = {

"name": "新能源汽车",

itemStyle: {

color: midColor

},

"children": [{

"name": "大型企业",

itemStyle: {

color: fatherColor

},

},

{

"name": "中型企业",

itemStyle: {

color: midColor

},

},

{

"name": "小型企业",

itemStyle: {

color: smallColor

},

},

{

"name": "其他规模企业",

itemStyle: {

color: fatherColor

},

}

]

};

// 生物与新医药

let xclkQ = {

"name": "生物与新医药",

itemStyle: {

color: fatherColor

},

"children": [{

"name": "大型企业",

itemStyle: {

color: fatherColor

},

},

{

"name": "中型企业",

itemStyle: {

color: midColor

},

},

{

"name": "小型企业",

itemStyle: {

color: smallColor

},

},

{

"name": "其他规模企业",

itemStyle: {

color: fatherColor

},

}

]

};;

let data = {

"name": "行业分类",

itemStyle: {

color: fatherColor

},

"children": [swyyQ, xclkQ]

}

// 获取网页宽度

let width = 360;

let widthSize = 0.039 * width;

if (widthSize > 36) {

widthSize = 36;

}

let heightSize = widthSize * 2.6;

this.option = {

tooltip: {

trigger: 'item',

triggerOn: 'mousemove'

},

series: [{

type: 'tree',

data: [data],

left: '20%',

right: '20%',

top: '16%',

bottom: '32%',

symbol: 'square',

symbolSize: [widthSize, heightSize],

orient: 'vertical',

expandAndCollapse: true,

initialTreeDepth: 2,

label: {

position: 'top',

rotate: 0,

verticalAlign: 'middle',

align: 'center',

fontSize: 12

},

leaves: {

label: {

position: 'bottom',

rotate: -90,

verticalAlign: 'middle',

align: 'left'

}

},

animationDurationUpdate: 150

}]

};

// chart 图表里

const chart = await this.$refs.chart.init(echartsLime);

chart.setOption(this.option)

}
HTML代码实现部分
<template>

<view class="content">

<view class="mui-content" style="margin-top: 16px;">

<l-echart ref="chart" @finished="init"></l-echart>

</view>

</view>

</template>

<script>

import LEchart from '@/uni_modules/lime-echart/components/l-echart/l-echart.vue';

import * as echartsLime from '@/uni_modules/lime-echart/static/echarts.min'

export default {

components: {

LEchart

},

data() {

return {

option: {},

}

},

mounted() {

},

methods: {

async init() {

var fatherColor = 'green';

var midColor = 'rgb(193, 92, 31)';

var smallColor = 'rgb(247, 203, 174)';

// 新能源汽车

let swyyQ = {

"name": "新能源汽车",

itemStyle: {

color: midColor

},

"children": [{

"name": "大型企业",

itemStyle: {

color: fatherColor

},

},

{

"name": "中型企业",

itemStyle: {

color: midColor

},

},

{

"name": "小型企业",

itemStyle: {

color: smallColor

},

},

{

"name": "其他规模企业",

itemStyle: {

color: fatherColor

},

}

]

};

// 新材料行业

let xclkQ = {

"name": "生物与新医药",

itemStyle: {

color: fatherColor

},

"children": [{

"name": "大型企业",

itemStyle: {

color: fatherColor

},

},

{

"name": "中型企业",

itemStyle: {

color: midColor

},

},

{

"name": "小型企业",

itemStyle: {

color: smallColor

},

},

{

"name": "其他规模企业",

itemStyle: {

color: fatherColor

},

}

]

};;

let data = {

"name": "行业分类",

itemStyle: {

color: fatherColor

},

"children": [swyyQ, xclkQ]

}

// 获取网页宽度

let width = 360;

let widthSize = 0.039 * width;

if (widthSize > 36) {

widthSize = 36;

}

let heightSize = widthSize * 2.6;

this.option = {

tooltip: {

trigger: 'item',

triggerOn: 'mousemove'

},

series: [{

type: 'tree',

data: [data],

left: '20%',

right: '20%',

top: '16%',

bottom: '32%',

symbol: 'square',

symbolSize: [widthSize, heightSize],

orient: 'vertical',

expandAndCollapse: true,

initialTreeDepth: 2,

label: {

position: 'top',

rotate: 0,

verticalAlign: 'middle',

align: 'center',

fontSize: 12

},

leaves: {

label: {

position: 'bottom',

rotate: -90,

verticalAlign: 'middle',

align: 'left'

}

},

animationDurationUpdate: 150

}]

};

// chart 图表

const chart = await this.$refs.chart.init(echartsLime);

chart.setOption(this.option)

}

}

}

</script>

<style>

.content {

display: flex;

flex-direction: column;

}

</style>


